


Primary School League Tables for England app for iPhone and iPad
Primary School League Tables for England.
Updated yearly. Contains all the latest primary school data from the Key Stage 2 test results for 2013.
Do you want to know how well your childs school is performing?
Looking for a new school in your area?
Moving home and unsure what school to send your children to?
If any of the above apply then the Primary School League Tables for England App can help you make an informed choice.
The Primary School League Tables App has been designed to make it as easy as possible to search, compare and view various Key Stage 2 statistical data for each school.
All data is laid out graphically using a traffic light system so you can easily compare each school to another school, the local education authority average and national average.
You can save up to 5 favourite schools allowing for a direct comparison between each of your favourites in over 140 key performance aspects.
Search for a school by school name, address, town or postcode.
Browse all schools in England.
Data can be sorted by School Name, Reading, Writing and Maths Level 4 or Above and Average Point Score.
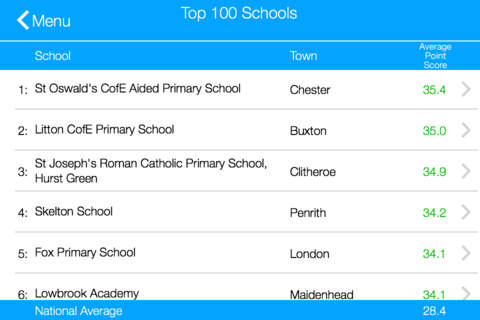
Top 100 schools in England.
View Ofsted reports and map for each school.
Key Stage 2 results data for well over 16,000 primary schools in England.
Each school shows over 150 pieces of information broken down into 9 categories:
School Information: Shows the school address, phone number, school type, religious denomination, age range, total number of pupils etc.
Topline: Comparison between 2013 and 2012 for the percentage of pupils achieving level 4 or above in reading, writing and maths vs the local authority and national average.
Pupil Progress: Percentage of pupils making at least 2 levels of progress in reading, writing and maths vs the local authority and national average.
Key Stage 2 Test Results: Shows the percentage of pupils achieving level 3 or below, level 4 or above, level 4B or above and level 5 or above and level 6, as well as the average point score and average level per pupil in reading, writing, grammar, punctuation and spelling, and maths vs the local authority and national average.
Closing the Gap: Shows how disadvantaged and non-disadvantaged pupils perform in reading, writing and maths for 2013 and 2012 as well as progress measures for reading, writing and maths vs the local authority and national average.
Teacher Assessment: Percentage of pupils achieving level 3 or below, level 4 or above, level 4B or above, level 5 or above and level 6 for english, reading, writing, maths and science for teacher assessments vs the local authority and national average.
Attainment: Shows how low, middle and high key stage 1 pupils are performing in reading writing and maths, as well as how they are progressing from key stage 1 for reading, writing and maths vs the local authority and national average.
English as Additional Language and Gender: Show boys, girls and pupils with english as additional language are performing in reading writing and maths as well as progress measures from key stage 1 for reading, writing and maths vs the local authority and national average.
Cohort: Percentage of pupils with low, medium and high key stage 1 attainment, key stage 1 average points score. Percentage of disadvantaged pupils, english as additional language, SEN, and non-mobile pupils vs the local authority and national average.